Granger causality and Intrade data.
March 6, 2008 personal mathematics
Granger causality is a technique for determining whether one time series can be used to forecast another; since the Intrade market provides time series data for political questions, we can look at whether political outcomes can be used to forecast other political outcomes.
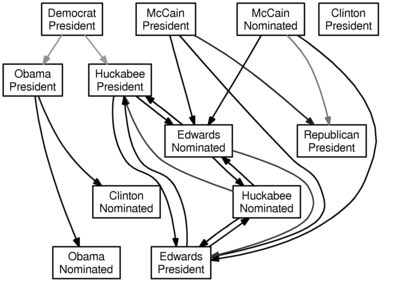
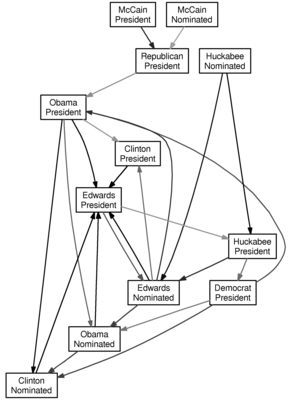
There’s a library for the statistical package R to do the Granger test, and Intrade produces CSV market data. I fed the market data for various contracts since January 1, 2008 into R, and the output of that into GraphViz to make a nice-looking visualization; in particular, I connect to if Granger-causes with -value less than 0.05. Darker arrows have smaller -values. This is all an embarassing misuse of statistics and -values, but it is quick and easy to do, and the results are fun to see.
Here is the graph for a lag of one day (i.e., does yesterday’s value of predict today’s value of ):

Here is the graph for a lag of two days (i.e., can the two previous days of data for be used to forecast the next day of data for ):

And here is the graph for a lag of three days:

Don’t take this too seriously. And one word of warning: an arrow from to does not mean that if is more likely, then is more likely—rather, it ought to mean that past knowledge of can be used to forecast . I suppose it would be interesting to add some color for the direction of the relationship, and maybe I’ll do that when I have another free hour.