Political relationships hidden in markets.
March 8, 2008 personal
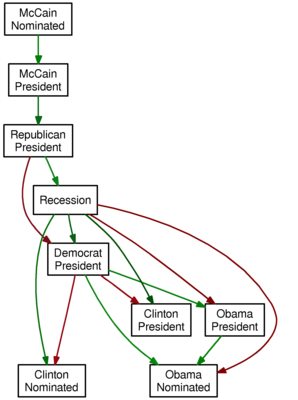
I’m again applying Granger causality to time series data from Intrade. This time, however, I connect box A to box B with a
- green arrow if A becoming more likely causes B to become more likely, and with a
- red arrow if A becoming more likely causes B to become less likely.
Shorter arrows suggest stronger relationships (technically, a lower p-value).
Running the algorithm on the market data since January 1, 2008 with a lag of two days produces the following graph:

- tautologies (McCain’s nomination makes him more likely to be president, and McCain’s being president makes it more likely that a Republican is president) but also some
- conventional wisdom (a recession makes Clinton more likely to be nominated, but Obama less likely to be nominated; perhaps the perception that Obama would fare better in the general election explains the red arrows from “Democrat President” to Clinton, and the green arrows from “Democrat President” to Obama).
It’s amazing to me (and hopefully also to you) that the relationships between the prices of these Intrade contracts manages to encode popular sentiments.