Visualizing pineapple pancakes.
January 30, 2008 personal
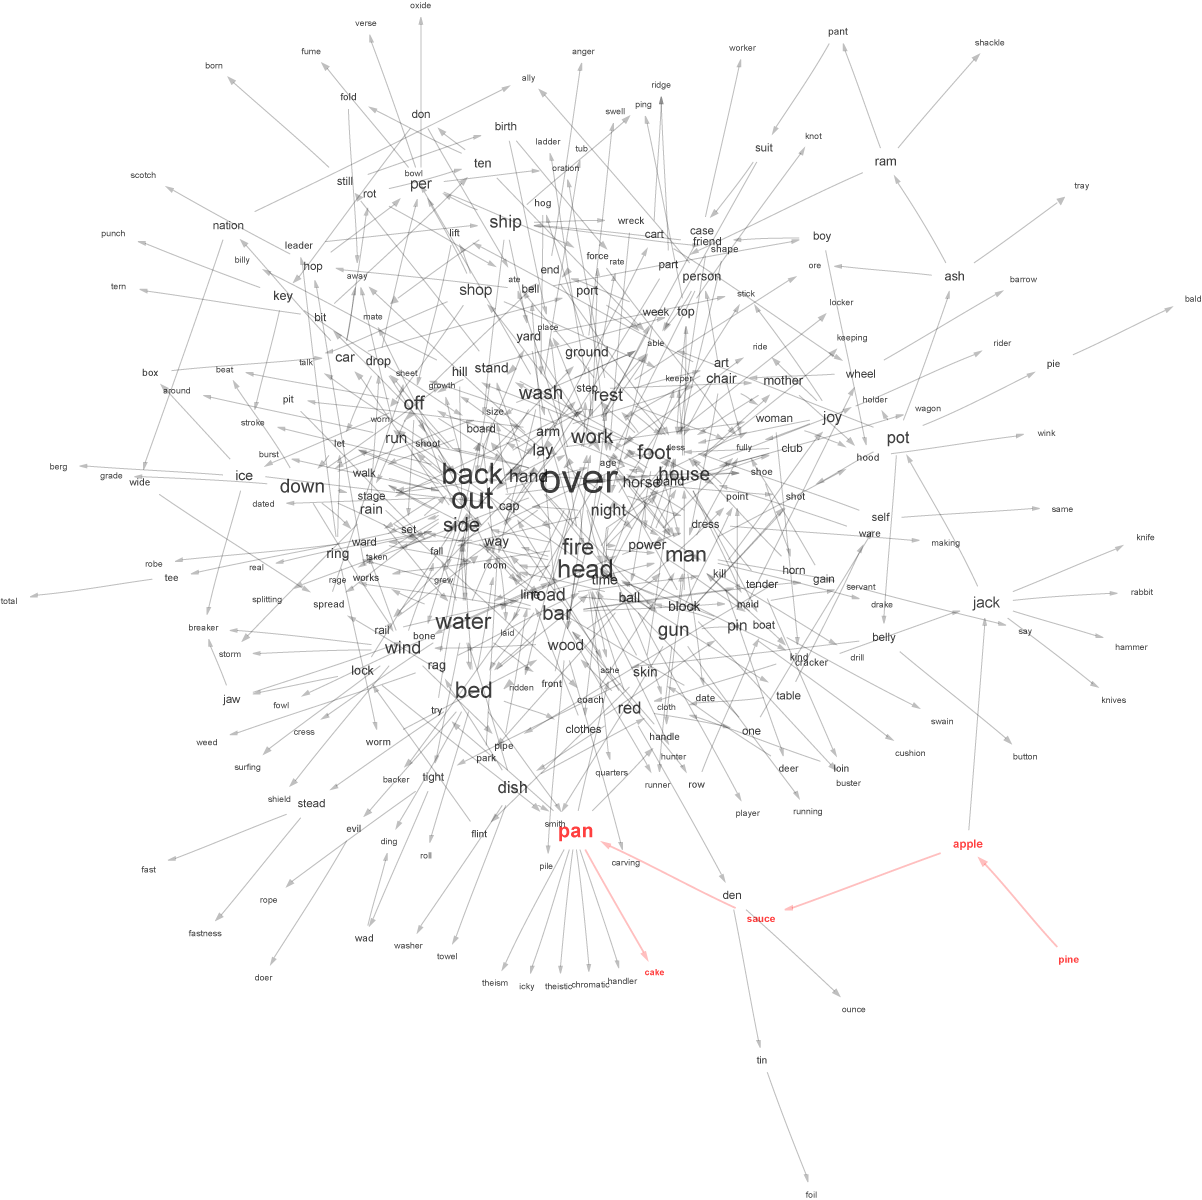
The pineapple sauce pancake graph has English words as vertices, and a directed edge from to if the concatenation is also an English word. For instance, there is a vertex labeled pine, and a vertex labeled apple, and an edge from pine to apple.
Anyway, the graph is huge; and the usual visualization tool (Graphviz) doesn’t work particularly well on the whole graph, so I took a few hundred vertices around pine, apple, sauce, pan, and cake. The result was the following: