Visualizing pineapple pancakes.
January 30, 2008 personal
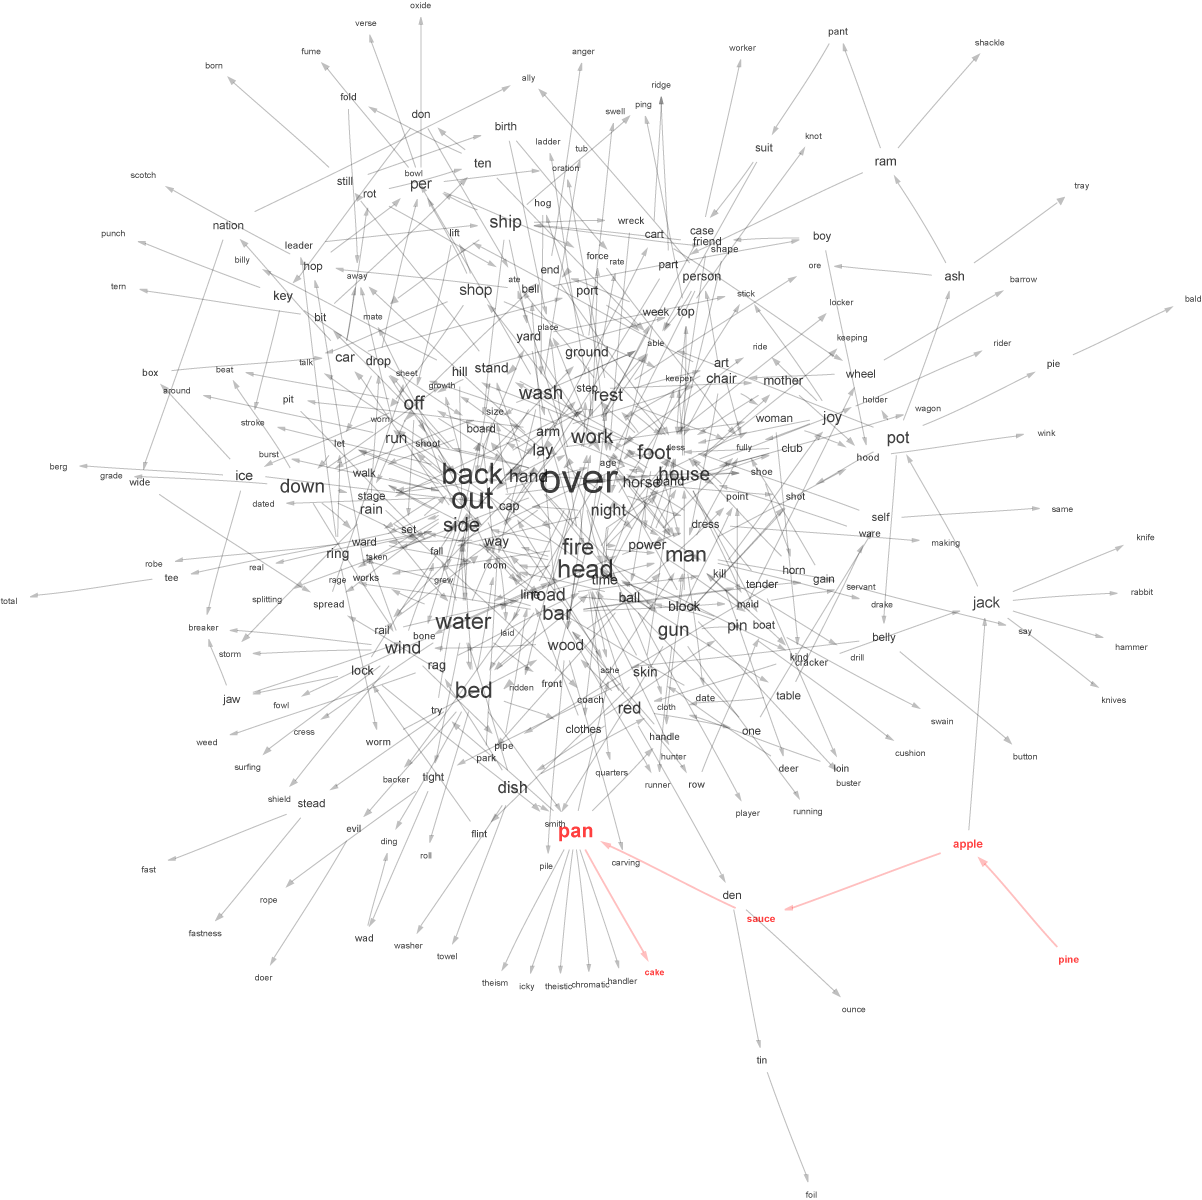
The pineapple sauce pancake graph has English words as vertices, and a directed edge from to if the concatenation is also an English word. For instance, there is a vertex labeled pine, and a vertex labeled apple, and an edge from pine to apple.
Anyway, the graph is huge; and the usual visualization tool (Graphviz) doesn’t work particularly well on the whole graph, so I took a few hundred vertices around pine, apple, sauce, pan, and cake. The result was the following:
Clustering texts with an obvious grouping.
January 28, 2008 personal
It was pointed out to me by Kenny Easwaran that I ought to try clustering texts that already have a natural grouping.
So I ran the clustering program on 15 texts written by three authors, and here is the result:
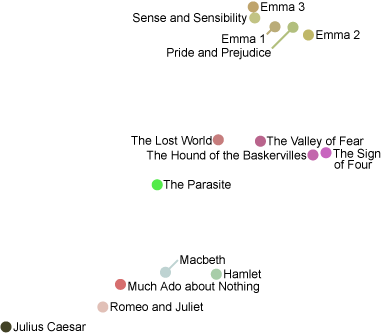
The largest eigenvalue is 25 times bigger than the next largest eigenvalue, and picks out the author pretty well. The top pile consists of Jane Austen’s books (with Emma split into three volumes). The middle pile consists of Sir Arthur Conan Doyle’s books, with the Sherlock Holmes mysteries (Valley of Fear, Sign of Four, and Hound of the Baskervilles) grouped closer than the others. The bottom pile are five of Shakespeare’s plays.
Of course, these people are all pretty different. As requested below by Theo, let’s run it one more time, using 12 books from George Eliot, Jane Austen, and the Brontë sisters.
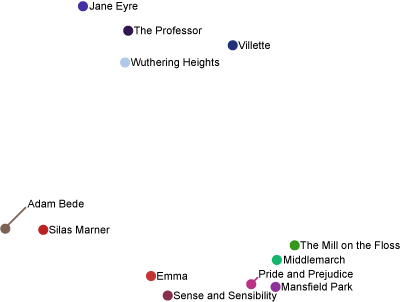
Well, that didn’t quite work. The books by the Brontë sisters (Wuthering Heights, Villette, The Professor, Jane Eyre) have been separated from the others, but George Eliot and Jane Austen are getting mixed together. Admittedly, if you just project to the y coordinate, the authors are sitting in disjoint intervals. Nevertheless, this isn’t as nice as I might hope; so let’s run it again, just on the eight books written by the two authors that aren’t being sufficiently separated:
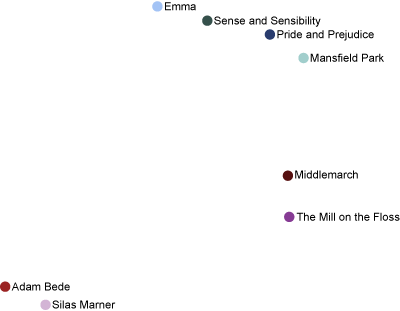
I suppose this is somewhat better, though it’s basically just a stretched out and inverted version of the previous image. Jane Austen’s books (Sense and Sensibility, Pride and Prejudice, Mansfield Park, Emma) are all up on top, and George Eliot’s books still aren’t piled together.
You might have guessed that I have Project Gutenberg to thank for the text files (including the Shakespeare plays).
Clustering Shakespeare.
January 23, 2008 personal
I ran my clustering program (which I just ran on the New Testament) on Shakespeare’s plays—which were conveniently packaged into a text file by Open Source Shakespeare.
The result was the following graph:
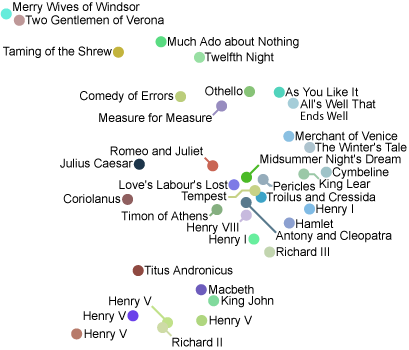
I know little about Shakespeare, so I can’t say too much about the above image. I’d love to know what you think: does this arrangement of his plays make any sense?
Given that modern processors are so good at vector and matrix calculations, I’m surprised that this sort of visualization tool doesn’t appear in more places. For instance,- Your blogs and email could be organized this way. Imagine lasso-ing a bunch of similar emails to reply to them all at once!
- News could be organized into nice piles.
- Your desktop and personal files could be arranged automatically into relevant piles.
Then again, maybe the idea of piles appeals to me more than most people—just look at how I organize the papers and books on my desk!
Clustering the New Testament.
January 22, 2008 theology
During Bible study last week, it was mentioned that people have used statistics to “determine” authorship of books of the Bible. Having a couple free hours last night, I tried my own experiment on the New Testament.
The procedure was easy: I downloaded the Nestle-Aland 26th edition of the New Testament; each book in the New Testament became a vector , with counting the number of times word appears in the book. The cosine of the angle between two such vectors measured how similar the corresponding books are. I packaged these cosines into a matrix, the entry of which measured how similar books and are.
Of course, this is a matrix. To turn these numbers into a nice picture, I projected the books onto a lower dimensional space spanned by the eigenvectors having the five largest eigenvalues (this is known as Principal Component Analysis); I chose five dimensions, displayed using location (two dimensions) and color (three dimensions, namely hue, saturation, and luminosity). The result is the following graph:
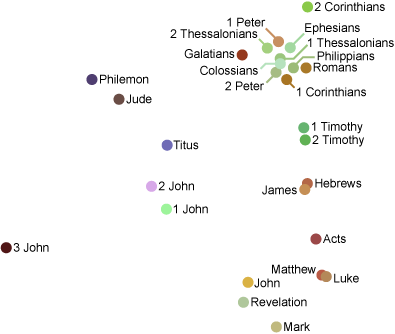
- The Gospels are all in the lower right hand corner.
- Paul’s epistles (and Peter’s?) are mostly in the upper right hand corner.
- Revelation is close to John.
- Hebrews and James are close to each other? Why?
All told, I think this is a pretty good graphical display of the structure of the New Testament, especially considering we used nothing but the Greek text and linear algebra!
NPR and wedding dresses.
November 15, 2007 personal
While we (meaning my wife and I) were filling out the forms for our marriage license, we were interviewed by NPR for Morning Edition! A copy of the broadcast is available online.
National Bingo Night.
May 30, 2007 personal
National Bingo Night (which seems to me to be very silly, but ignoring that…) has a “play along at home” game, where you print out a bingo card.
How would I design this? I had hoped that the website generated a Bingo card, digitally signed it, and then sent the signed card to the user. If it had been designed that way, ABC wouldn’t even need to remember which cards had been generated, as long as their private key wasn’t compromised.
How many Bingo cards are there? The first two and last two columns of a Bingo card are a sequence of 5 numbers drawn from 15 possible numbers, and the middle column has a “free” square, so it consists of only 4 numbers from 15 possible numbers. Anyway, this is , which is a big number. In base 36, it is 18 digits long.
But the base 36 number below the National Bingo Night cards is only 10 digits long. Thus, this 10 digit number can’t encode the whole Bingo card–there are too many cards.
The official rules make this totally clear:
“ABC’s National Bingo Night” (the “Show”) Home Viewer Sweepstakes (June 2007) (the “Sweepstakes”) is a seeded instant win game. Unlike bingo, where selected numbers are drawn live before an audience of players who have purchased or otherwise obtained randomized cards, in this Sweepstakes the relevant numbers are known to Sponsor ahead of time, due to the nature of the recording schedule of the Show. Based upon the numbers drawn during prior in-studio tapings of the Show, Sponsor then randomly distributes a specific, predetermined number of potentially winning Sweepstakes “Game Cards.”
So they already know who will win, because the numbers have already been drawn. The serial number only has to encode “Winner” and “Loser.” Not so interesting.
I wonder, though, if there are other web games that actually use digitally signed objects for fun purposes?
Istanbul, not Constantinople, as a cover, in two senses.
April 20, 2007 personal
I am frequently amazed to discover that songs which I had believed to have been original are actually covers. It turns out, for instance, that TMBG’s “Istanbul (not Constantinople)” is a cover of a song from the 1950s.
Ironically, one might argue that Istanbul is itself a cover of Constantinople–and that argument (unifying form and content) reminds me of the language games played by Salt: Grain of Life, a book asserting that its very structure resembles the culinary crystal it purports to discuss.
Spectral rigidity.
April 19, 2007 mathematics
For a metric space, and , define the length spectrum of S to be . It might be better to call this the “distance spectrum” or “distance set.”
Ian, during his Pizza seminar, gave the following definition: a set is a -distance set if has cardinality no greater than . In words, the distances between points in a -distance set take on no more than possible values.
The question that Ian answered is the following: how big can a -distance set in be? Clever linear algebra shows that the size grows polynomially in with degree . A related exercise is the following: suppose and is countable; prove that is countable.
Now here is my question: suppose and is measurable with measure . Can one then bound the measure of ? Ian asked this for the counting measure, but presumably one can get results for Lebesgue measure. Likewise, one can ask this for spaces other than .
All this talk of spectra has gotten me thinking very vaguely about a bunch of stuff–some random ideas! One context in which I have seen spectra is for lattices in Lie groups; I don’t know, but definitely ought to know how much control the spectrum exerts on the lattice. As a baby example, it is true that one can recover a lattice from its length spectrum? Similarly, a Riemannian manifold has a length spectrum, and the “marked length rigidity conjecture” asks how much of the Riemannian structure is related to this. See [1] for more information.
Finally, it is possible to define a “spectral distance” (I’m mis-using so many word here!) between two lattices in a Lie group. Namely, given , define , i.e., the Hausdorff distance between their spectra. Though you’d probably want something slightly more refined (to count multiplicities). You could likewise say that two manifolds are “nearly isospectral” if their spectra are not so far apart in Gromov-Hausdorff distance. I have no idea whether this is a good idea; it probably isn’t. In any case, Sunada [2] constructs isospectral manifolds, and it would be interesting to know how easy it is to construct nearly isospectral manifolds. A braver person than I might conjecture that two manifolds are isospectral if they are -nearly isospectral for small enough .
At last, can one detect arithmeticity of a lattice from its spectrum? I suppose if I were really hip, I would ask: can a geometer hear arithmeticity? I think Sunada’s examples are all arithmetic?
[1] A. Furman, Coarse-geometric perspective on negatively curved manifolds and groups, in: Rigidity in Dynamics and Geometry (Cambridge, 2000), Springer, Berlin, 2002: pp. 149–166.
[2] T. Sunada, Riemannian coverings and isospectral manifolds, Ann. Of Math. (2). 121 (1985) 169–186.
Vitamin C and analyzing myself.
April 4, 2007 personal
Most mammals produce their own vitamin C, but humans carry a mutated form of the gene responsible for one of four enzymes enzymes necessary for vitamin C production, and so we humans must find it in our diets. In effect, every human being has a metabolic deficiency!
And in light of this wonderful news, why not ingest tremendously huge amounts of vitamin C?
In fact, I’d like to make this into a double-blind study of myself. Here is what I would like to do: randomly take either a placebo pill or a vitamin C pill (without my knowing which I took), and record the type of pill I took. At the end of the day, I would further record how I feel (as a number from 1 to 100, perhaps), and then do a regression to see if the type of pill I am taking is correlated with how I feel.
In fact, I should do this with all sorts of things in my life. Certainly I should be doing this with my caffeine intake, because I feel so convinced that I am much happier while drinking coffee, but that may only be an effect of the coffee–which is, wonderfully and exactly, the point.
To feed oneself for a week.
March 27, 2007 personal
The question is: how little can I spend to feed myself for one week? I ought to eat 2000 calories/day, so I’ll need to purchase 14,000 calories/week.
Here’s a “healthy” option: just eat apples. One ounce of apple has 15 calories, so I’ll need to eat 58 pounds of apples per week; I might be able to get this many apples for 29 dollars.
But I can do better! One “Take 5” candy bar is delicious and contains 210 calories, so I’ll need to eat 66 candy bars per week; in the best of all possible worlds, I might be able to purchase this many candy bars for 22 dollars.
I could buy a pound of mayonnaise for two dollars. Apparently a pound of mayonnaise has 3200 calories, so I could get more than enough calories for just ten dollars a week.
Presumably I could do significantly better with potatoes or with rice?